Understanding Why It's More Important to Track User Experience vs. Scan Rate of QR Code

Tracking the user experience is better than tracking the code
 Tracking the code alone can't reveal the scope and depth of your campaigns strengths or weaknesses. When you measure the entire mobile user experience, you are able to understand how people are reacting to and interacting with your message.
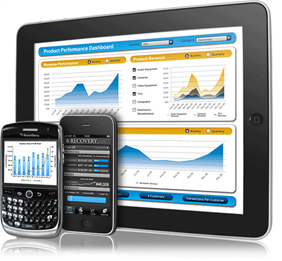
 PRINT2D's mobile analytics cover both Passive and Active statistical data along with sorting functionality that makes viewing reports a pleasure.
Get the BIG picture with PRINT2D mobile analytics
Visitors Statistics (Passive Device Related)
IP Address | Host | Domain Country | Platform | Device | Browser
User Experience Statistics (Active User Behavior)
Referrers & Searches | Page views | Time per page | Social shares / likes | Clickthroughs | GEO tracking (city-level)
Breakdowns and Sort Lists
Hourly | Daily | Weekly | Monthly
Sort Lists (Top)
Referrers | Searches | Search Engines | Pages | IP Addresses | Hosts | Domains | Countries | Platforms | Devices | Browsers
Tracking the user experience - not the code!
Please contact us for more information about PRINT2D mobile analytics. Sign up for our PRINT2D Alerts and we'll notify you as soon as we add new features. 
top


